You are using an out of date browser. It may not display this or other websites correctly.
You should upgrade or use an alternative browser.
You should upgrade or use an alternative browser.
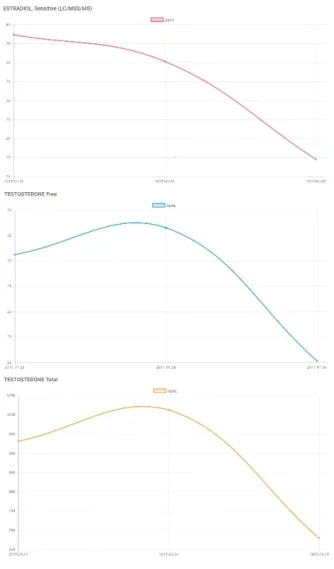
Tracking T and E2 Levels Over an Injection Cycle
- Thread starter johndoesmith
- Start date
johndoesmith
Member
The dips are pretty close to what Jill (from Defy) told me, mine would be.
Yeah? What's your SHBG again?
Jill is great, I had my consult with her last time, although I haven't spoken to the other RNs much, and I'm sure they're awesome as well.
Vince Carter
Banned
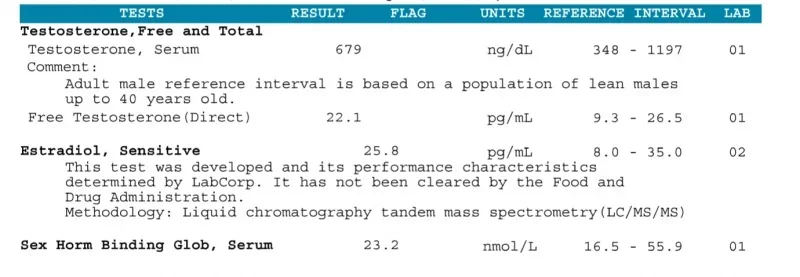
Just because I'm a little dense, you are saying E3D as in EOD, right? Real neat demo labs, John, thanks for doing that and sharing. I might have thought you'd have a little less of a dump @ 72hrs with an SHBG of 23
Vince Carter
Banned
Theoretically, you just place the graphs side-by-side and have a representation over more than the three days as everything, as long as there's strict compliance, should, just repeat in the same way each day.
Vince
Super Moderator
never had a reason to test it and don't plan toYeah? What's your SHBG again?
Jill is great, I had my consult with her last time, although I haven't spoken to the other RNs much, and I'm sure they're awesome as well.
Theoretically, you just place the graphs side-by-side and have a representation over more than the three days as everything, as long as there's strict compliance, should, just repeat in the same way each day.
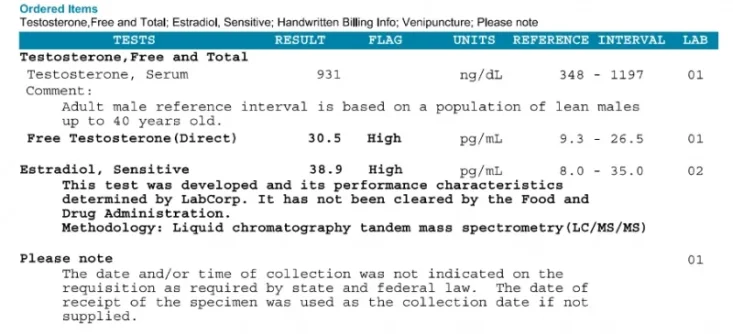
What I'm really after is how much time there is between the low of 679 on the right and the starting level of 931 on the left.
johndoesmith
Member
Just because I'm a little dense, you are saying E3D as in EOD, right? Real neat demo labs, John, thanks for doing that and sharing. I might have thought you'd have a little less of a dump @ 72hrs with an SHBG of 23
I mean E3D as in every 3 days. Inject Monday, Thursday, Sunday Wednesday then Saturday.
Yeah, I was shocked by the drop on day 3 as well myself. I have other labs that were done at trough recently with 786 total and 28 sensitive E2.
So it's not far off. I also had labs done back in October at trough with 914 and 29 E2 I think. Interesting how my trough dropped since then.
johndoesmith
Member
So does this mean that the levels on the right hand side will rise to the levels on the left hand side in the next 24 hours? I'm trying to understand how the levels change over a complete injection cycle.
Probably. It will depend on many factors, say if I use a different muscle that has different absorption or if my shot goes SubQ.
What I'm really after is how much time there is between the low of 679 on the right and the starting level of 931 on the left.
Although the 931 aren't "starting" levels because they were done 24 hours after injecting.
johndoesmith
Member
Thanks for sharing this! Yesterday I started 70mg test cyp every 3.5 days so very similar dose. No HCG or AI.
Nice. That was what I was originally prescribed, but I made an adjustment that would work better with my doctor's permission.
So it's similar in weekly dosage!
johndoesmith
Member
Wonder why E2 peaks before testosterone?
I think it may have to do with hCG.
I take both at the same time, and hCG's half life is shorter than testosterone's.
Today I had my 6 month checkup with my Doctor. He OK the twice a week injections and moved it to .5ml per injection. My T levels were 884 two days after the injection. He said it may climb but we will watch it. Red count high but still good (16.2). I will give blood next week. PSA also good in normal range 2.1. I will start the twice a week when this weeks injection has timed out. From the chart I suspect the 884 is my max level being it was two days after the injection. He also discussed the Trimix. I use a low dose and when I asked the odds of using the Trimix and recovering natural erections. He said it was a hit and miss. the low dose gives me better odds, but not to be disappointed if it did not come back to normal.
Vince
Super Moderator
You probably know, I did finally had my shbg tested. 38.1 range 19.3-76.4Yeah? What's your SHBG again?
Similar threads
- Replies
- 4
- Views
- 948
Online statistics
- Members online
- 5
- Guests online
- 599
- Total visitors
- 604
Totals may include hidden visitors.
Latest posts
-
-
-
-
Left Ventricle Hypertrophy and Nandrolone ( Decadurabolin )
- Latest: Guided_by_Voices
-
-


